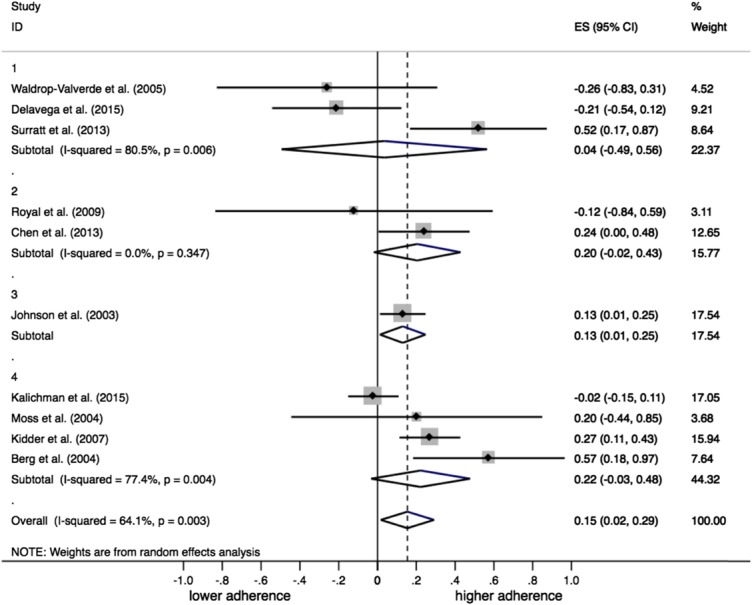
FIGURE 3.

Subgroup analysis comparing effect size and 95% confidence limits by Quality Assessment scale. Values on the QA scale range from 1 (lowest quality) to 4 (highest quality). The x-axis unit of measure is SMD. An SMD of 1.0 indicates that mean adherence for the housing comparison groups differ by 1 SD. Symbols: the size of the square boxes represents the relative weights of the primary studies in the meta-analysis. The dot in the center of a box indicates the point estimate of effect size, and the lines extending from the left and right of the box depict the 95% CI. The diamonds represent the subgroup summary effects and the overall effect. The center of a diamond indicates the point estimate of effect size, and the width of a diamond is the precision of the estimate. ES, effect size.
