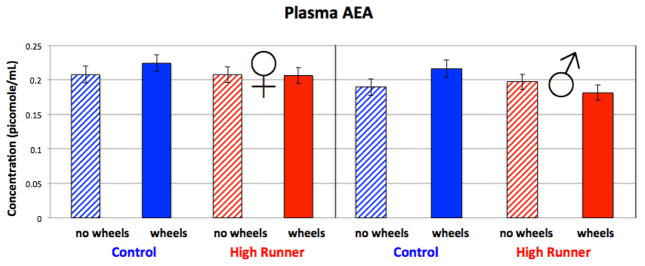
Figure 4.
Levels of AEA in mouse plasma collected during peak activity on the 6th night of wheel running. See Table 4 for statistical results, which indicated a linetype by wheel access interaction (p = 0.0628). Values are LS means +/− standard error from SAS Proc Mixed. N = 185.

