
Figure 2.
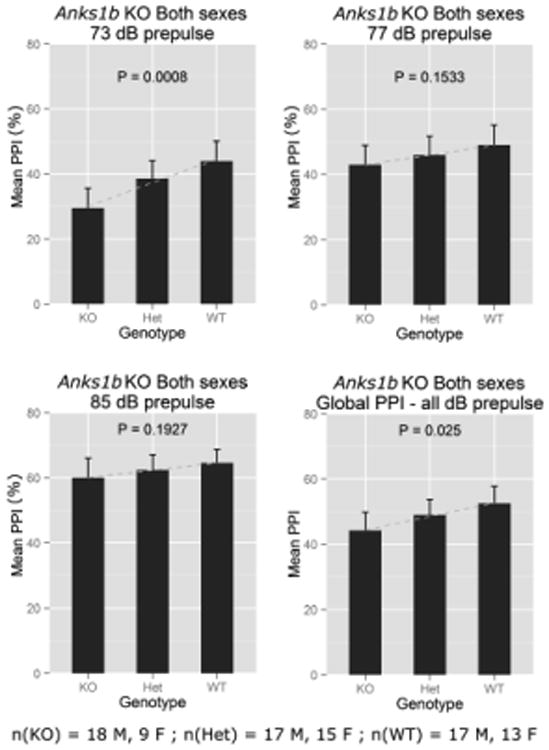
Baseline percentage (%) PPI at three different prepulse intensities and global PPI by genotype for the Anks1btm1b allele. Means are plotted for each group and error bars show 95% confidence intervals.
Official websites use .gov
A
.gov website belongs to an official
government organization in the United States.
Secure .gov websites use HTTPS
A lock (
) or https:// means you've safely
connected to the .gov website. Share sensitive
information only on official, secure websites.
Baseline percentage (%) PPI at three different prepulse intensities and global PPI by genotype for the Anks1btm1b allele. Means are plotted for each group and error bars show 95% confidence intervals.