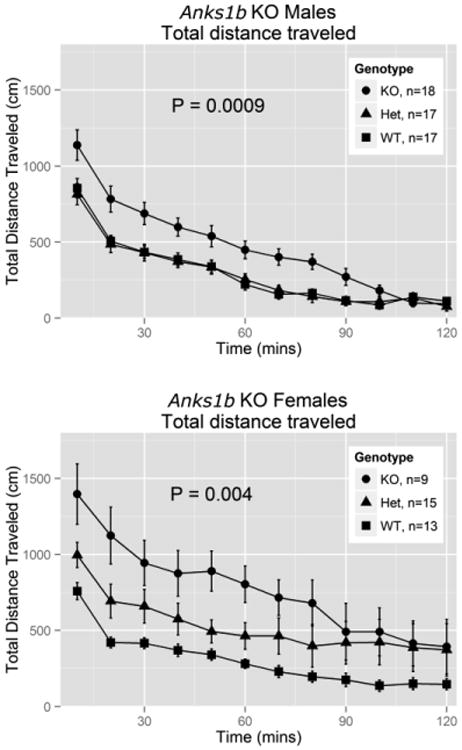
Figure 3.

Baseline locomotor activity (total distance traveled in cm) in Anks1btm1b mice over a 2-h observation period, displayed in 12, consecutive 10 min periods. Means are plotted for each group for each 10 min period and error bars show 95% confidence intervals. We observed a significant sex difference and so have plotted both sexes independently. The reported P-values are for tests of total distance traveled by genotype over the entire 2-h period.
