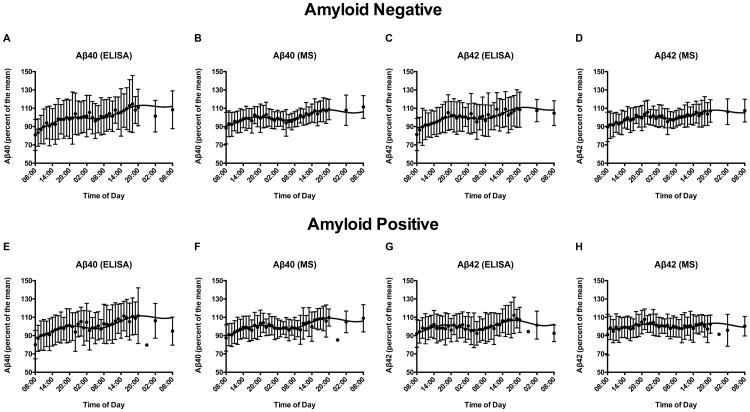
Figure 1.
Cosinor analysis of percent of the mean for Aβ40 and Aβ42 measured by enzyme-linked immunosorbent assay and mass spectrometry. Group-averaged Aβ40 and Aβ42 measured in serial cerebrospinal fluid (CSF) by enzyme-linked immunosorbent assay (ELISA) and mass spectrometry (MS) in 39 amyloid-negative (A-D) and 38 amyloid-positive (E-H) individuals over 48 hours. Concentration values were converted to percent of the mean for all participants and then averaged for each group. The cosinor fit and standard deviations are shown. MS quantitation resulted in narrower standard deviations (all p≤0.001) and therefore more precise fit to the cosine wave compared to ELISA. Amyloid-negative individuals: A. Aβ40 measured by ELISA. B. Aβ40 measured by MS. C. Aβ42 measured by ELISA. D. Aβ42 measured by MS. Amyloid-positive individuals: E. Aβ40 measured by ELISA. F. Aβ40 measured by MS. G. Aβ42 measured by ELISA. H. Aβ42 measured by MS.

