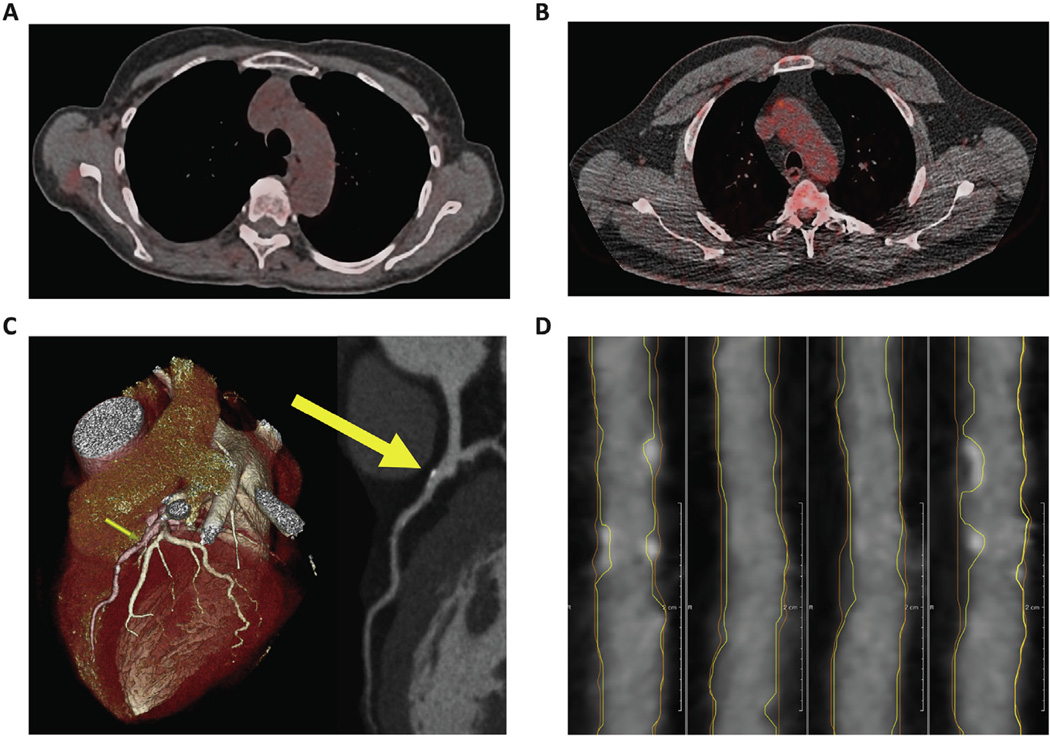
Fig. 1. Plaque imaging by coronary CT angiography and aortic vascular inflammation by FDG PET/CT.
(A) FDG PET/CT image of a patient with psoriasis and no psychiatric history. (B) FDG PET/CT image of a patient with psoriasis and comorbid depression showing increased FDG uptake in the aortic arch indicative of higher vascular inflammation. (C) CCTA 3D reconstructed image of the same patient in Panel B showing stenosis of the left anterior descending artery corresponding with plaque on CCTA (yellow arrows). (D) Multiplanar reconstructed CCTA image of the right coronary artery of the same patient. Lines delineate the vessel wall (orange) and lumen (yellow), showing areas of increased wall volume and both calcified and non-calcified plaque. (For interpretation of the references to colour in this figure legend, the reader is referred to the web version of this article.)

