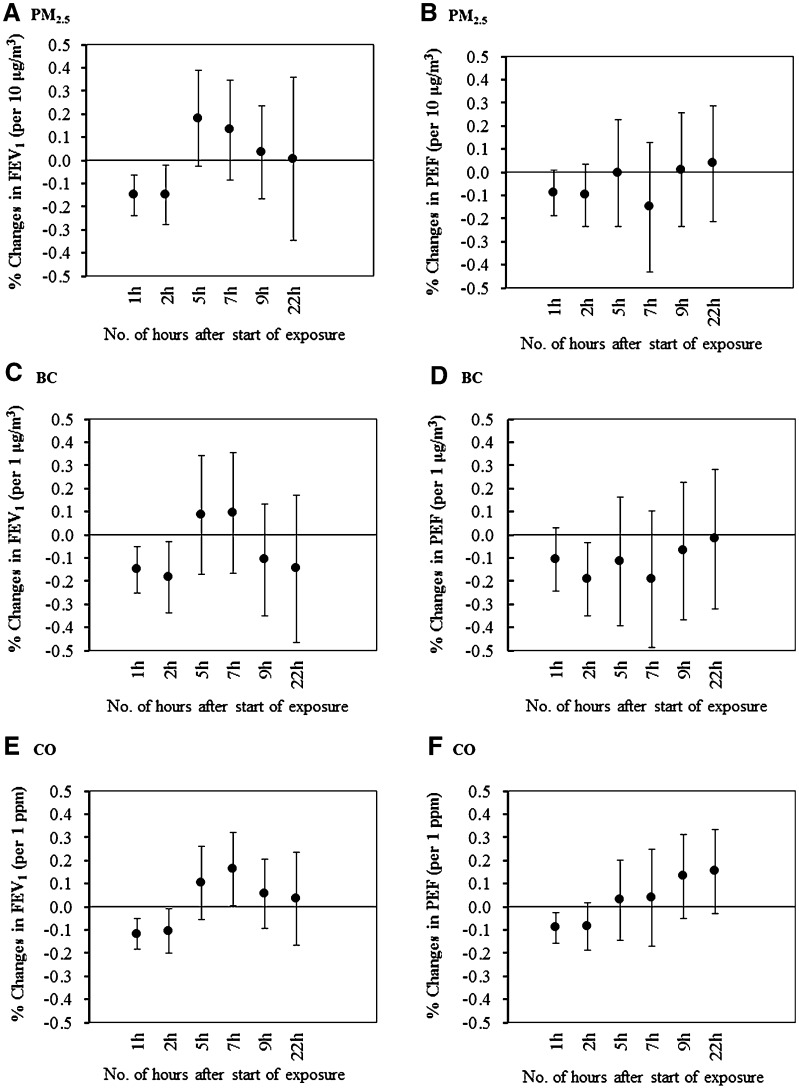
Fig. 1.
Percent changes and 95 % CI in FEV1 and PEF associated with per incremental increases in traffic-related air pollutants’ concentrations using the mixed data of the transport hub and the park. (Changes in the FEV1 and PEF were shown according to incremental changes for PM2.5 (a, b), BC (c, d), CO (e, f), Per incremental increases for each pollutant were PM2.5: 10 μg/m3; BC, 1 μg/m3; CO 1 ppm; Time points for abbreviation: 1, 2 h means during exposure 1 and 2 h, respectively; 5, 7, 9, 22 h means post-exposure 5, 7, 9 and 22 h, respectively)

