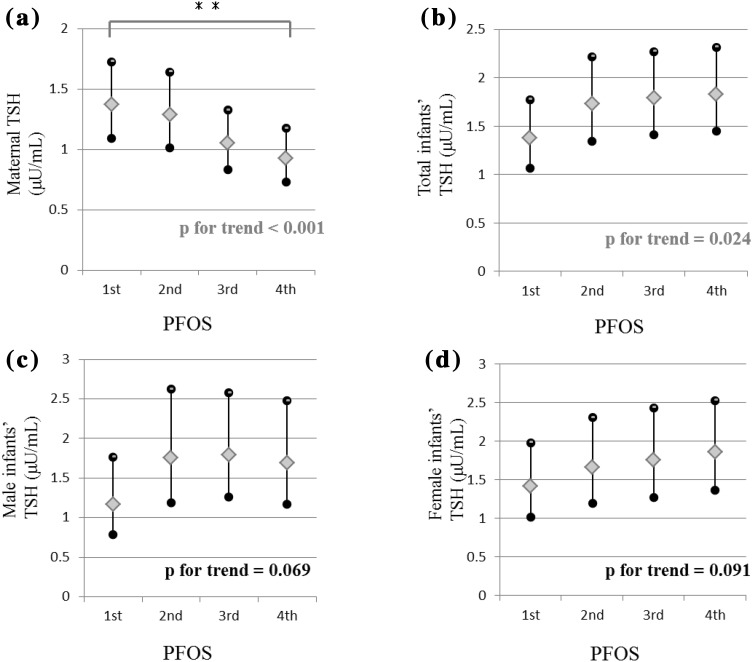
Fig. 1.
Least square means of maternal and infant TSH, according to maternal serum PFOS concentration quartiles (1.5 ≤ quartile 1 ≤ 3.5 ng/mL, 3.5 < quartile 2 ≤ 5.2 ng/mL, 5.2 < quartile 3 ≤ 7.0 ng/mL, 7.0 < quartile 4 ≤ 16.2 ng/mL). a Maternal TSH according to PFOS, b total infant TSH according to PFOS, c male infant TSH according to PFOS, d female infant TSH according to PFOS. Results are based on multiple linear regression models that were adjusted for the following factors: for a maternal age at delivery (years), BMI before pregnancy (kg/m2), parity (0/≥1), educational level (≤12/≥ 13 years), positivity for ATG and/or AMC (yes/no), intake of seaweed more than once a week (yes/no), blood sampling period for PFOS and PFOA (before/after delivery), and gestational week of blood sampling for TSH and FT4 (continuous variable); and for b–d maternal factors [maternal age at delivery (years), parity (0/≥1), positivity for ATG and/or AMC (yes/no), blood sampling period for PFOS and PFOA (before/after delivery), log 10 values of TSH and FT4 (continuous variable)] and infant factors [gestational weeks at birth (continuous variable), low birth weight (yes/no), and born via cesarean section (yes/no)]. **p < 0.01 compared to the first quartile, as calculated using the Hsu–Dunnett’s method. LSMs are indicated in rhombus and the black dots depict the upper and lower 95 % CI. ATC antimicrosome antibody, ATG antithyroglobulin antibody, BMI body mass index, FT4 free thyroxine, PFOA perfluorooctanoate, PFOS perfluorooctane sulfonate, TSH thyroid stimulating hormone

