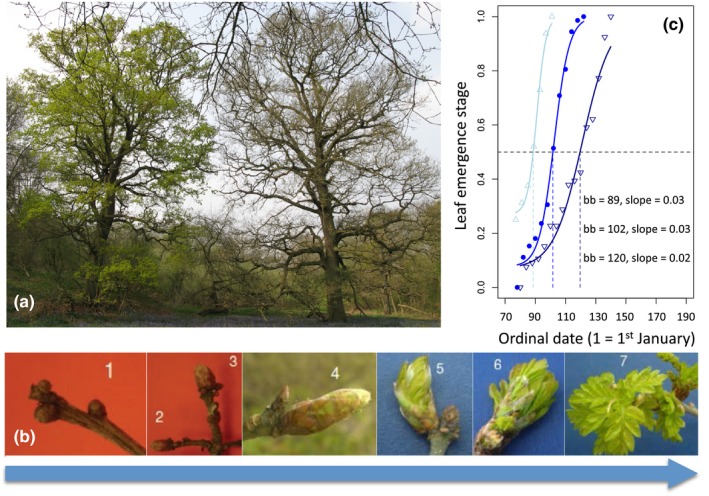
Figure 1.

Scoring tree phenology: (a) two neighboring oak trees with contrasting leaf budburst timing, (b) seven‐stage phenological key used to score oak bud development, and (c) leaf emergence trajectory for three oak trees in 2014 (symbols show field observations of bud stage, the dashed line indicates the point of budburst of each tree). Leaf emergence stage, ranging from 0 (dormant buds) to 1 (fully emerged leaves, was measured via visual inspection of the buds throughout early spring (see Methods section). Budburst date (bb) and development rate (slope of curve at budburst) for the three example trajectories are shown in the figure
