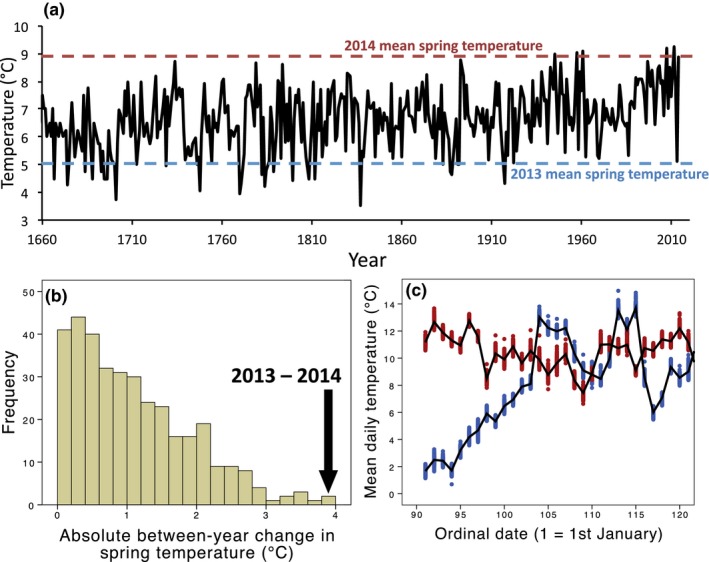
Figure 2.

Climate data: (a) annual fluctuations in mean spring temperatures for England (1660–2014, °C), (b) absolute mean spring temperatures differences for consecutive pairs of years (1660–2014, °C, N = 355), (c) daily mean temperatures for Wytham Woods from 200 sampling locations (blue = 2013, red = 2014), black lines show woodland‐wide means for the 2 years. Long‐term temperature data shown in (a) and (b) is collected by the Hadley Centre Central Observatory
