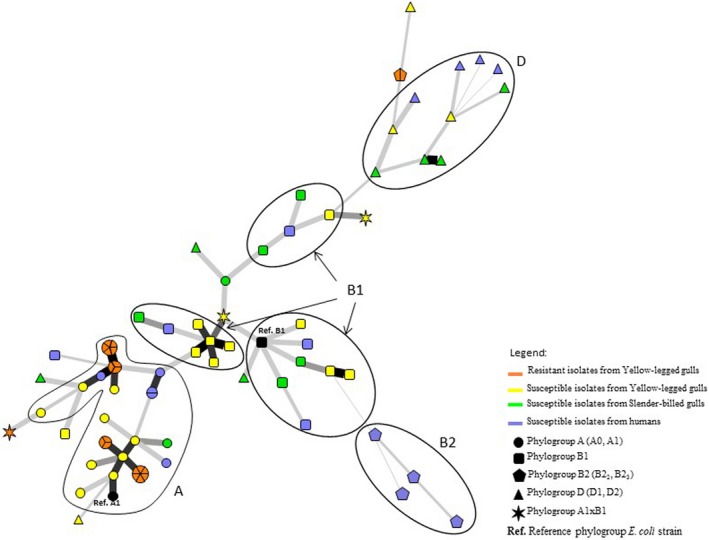
Figure 2.

Minimum spanning tree of 79 of the studied Escherichia coli strains based on MLST, SNPs and VNTR. The 13 strains for which part of the VNTR data was missing were excluded. The phylogroups are shown as ovals. Clonal complexes are indicated by symbols proportional in size to the number of strains within them. Black lines connecting strains indicate that they differ at (1) least by one VNTR (bold thick lines) to two VNTR and (2) seven markers (five MLST genes and two SNPs (the thinnest lines))
