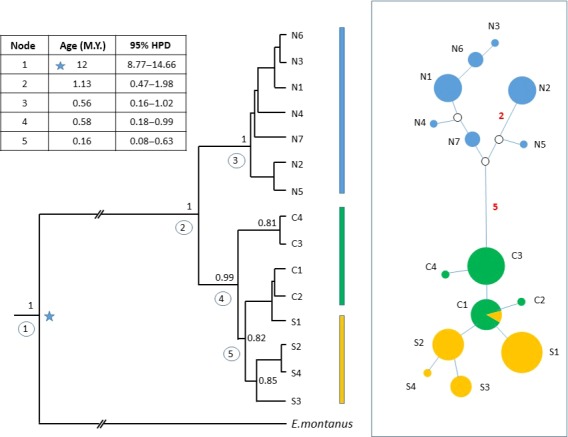
Figure 1.

Deep divergence revealed by mtDNA sequencing. Left: Bayesian phylogenetic tree of Euproctus platycephalus mtDNA haplotypes implemented in BEAST, using a strict molecular clock model. The tree was rooted with Triturus cristatus (not shown on figure for clarity). An arbitrary prior node age of 12 My was specified on the E. platycephalus–Euproctus montanus divergence node (starred). Values for posterior probabilities of >0.75 are shown at the relevant nodes. The inset table shows the inferred ages and 95% highest posterior density (HPD) intervals for the numbered nodes. The vertical bars to the right of the tree show clustering of haplotypes into north (blue), central (green), and south (orange) haplogroups. Right: Median‐joining haplotype network, implemented in NETWORK. Circle sizes are proportional to haplotype frequency and colored according to the region of origin of each individual with that haplotype. Numbers represent the number of nucleotide differences between haplotypes, where no number is shown lines between circles represent a single difference. Unrepresented intermediate nodes are shown as an open circle. The E. montanus sequence (not shown for clarity) is positioned in the network at 63 mutations from its closest E. platycephalus sequence, C2, and thus 64 from C1, the presumed ancestral haplotype
