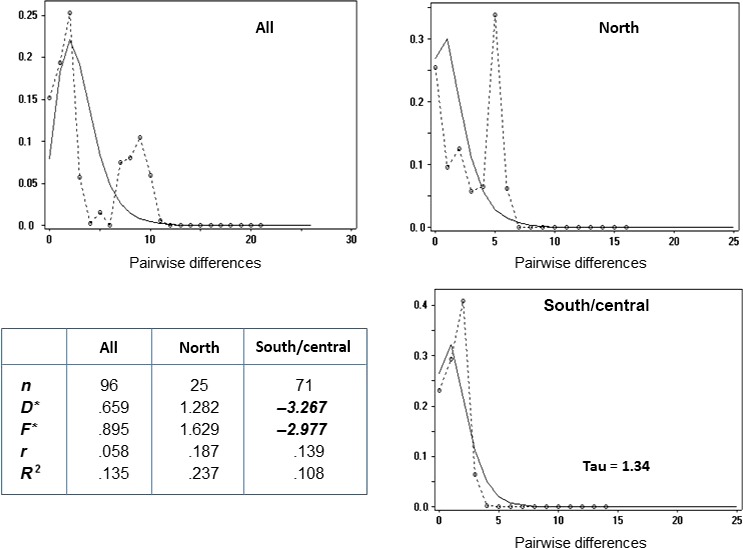
Figure 2.

Demographic expansion: pairwise nucleotide mismatch distribution. The graphs show the frequency of observed individual pairwise nucleotide site differences in the mtDNA D‐loop sequence (circles/dotted lines) in comparison with the pattern expected for a sudden expansion model (solid smooth line). The curves for the combined south/central regions show a good visual fit, with a peak at 1–2 nucleotides. The significantly negative values for the neutrality statistics D* and F*, shown in the table, are also consistent with demographic expansion in the south/central region, but not in the northern. all, All individuals; individuals from northern region; south/central, pooled individuals from south and central regions; n: number of individuals; D* & F*: Fu's neutrality statistics (Fu & Li, 1993); R 2:R 2 test for neutrality (Ramos‐Onsins & Rozas, 2002); r: raggedness index (Harpending, 1994); Statistically significant values are shown in bold italics
