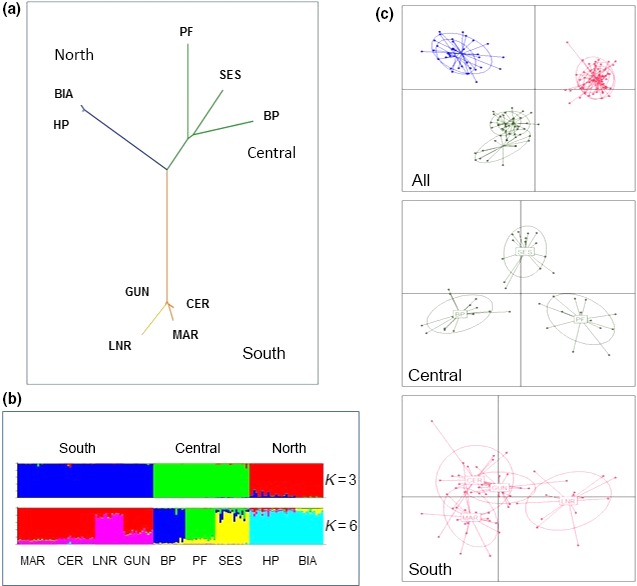
Figure 3.

Hierarchical population genetic structure of Euproctus platycephalus revealed by microsatellite genotyping. (a) Unrooted neighbor‐joining tree, based on pairwise genetic distance, showing strongly separated regional clades, with intraregional differentiation between the central populations, and partial differentiation between the southern. Branches are colored according to region (blue: north, green: central, orange: south). (b) STRUCTURE results for different values of K. The barplot columns represent the Bayesian assignment of individuals to each of K genetic clusters, for K = 3 and K = 6. The probability of membership to each shown as the height of the relevant colored segment. There is clear demarcation between genetic clusters coincident with the spatially defined population groups, consistent with the pairwise FST results. (c) DAPC scatterplots of first two principal components, showing individuals as points, and inertia ellipses for populations defined according to the nine main sampling sites. Points are color‐coded for region of origin (blue: north, green: center, red: south). The top panel shows the results when all nine groups are included, with clear separation according to region. The lower two panels show results from separate analysis of populations from the central and southern sites
