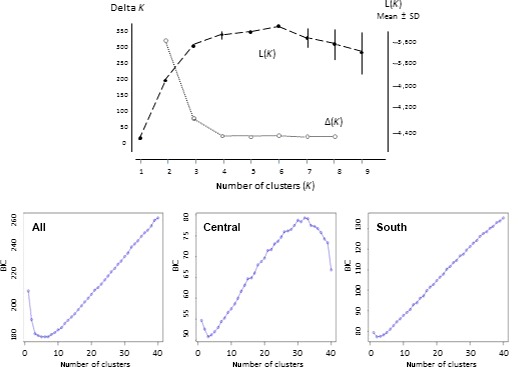
Figure 4.

Estimation of number of genetic clusters in microsatellite dataset. Top panel: Variation in posterior probability and deltaK for different numbers of clusters (K) in STRUCTURE. The mean posterior probability L(K), based on 10 replicate runs, increases sharply up to K = 3, reaching a maximum at K = 6. At values of K above this level, the probability decreases, with higher variance. DeltaK values (Evanno et al., 2005) most strongly support K = 2. Bottom panels: BIC values for different numbers of clusters (k) using clustering algorithm in adegenet. The curve for individuals from all nine sampling sites (left) mirrors the L(K) results. When analyzed separately, the central region (center) shows a clear elbow at k = 3, and the southern (right) at k = 2
