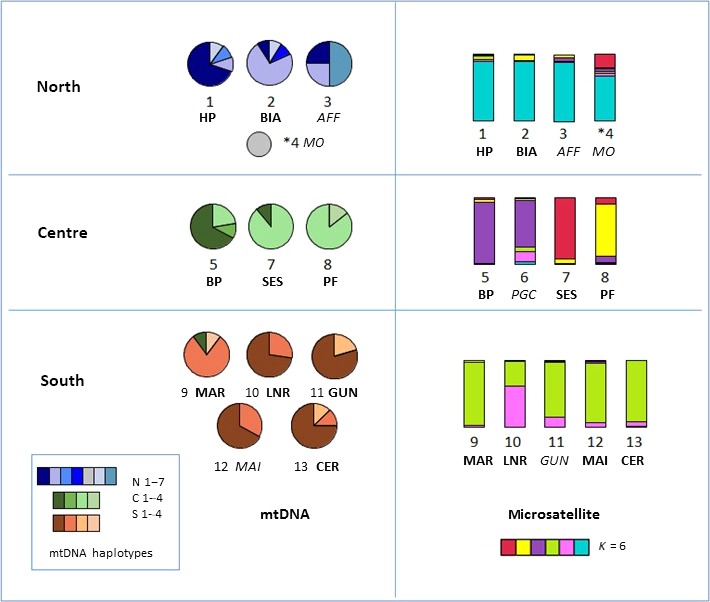
Figure 5.

Geographical distribution of mtDNA haplotypes and microsatellite genetic clusters, showing mitochondrial‐microsatellite discordance at intraregional level. Left panel: Pie charts showing patterns of mtDNA haplotype frequency distribution for sampling sites, grouped according to region. The haplotype for the individual from Monte Olia (MO) is shown as a small circle. Right panel: Bar charts showing the proportion of group membership assigned probabilistically to each of K = 6 clusters in STRUCTURE for each sampling site. For the single sample from Monte Olia, the individual result is shown (marked *, site 4). The nine major sampling sites are shown in bold and the supplementary sites in italic. See Figure 6 for map of Sardinia showing the locations of the sampling sites
