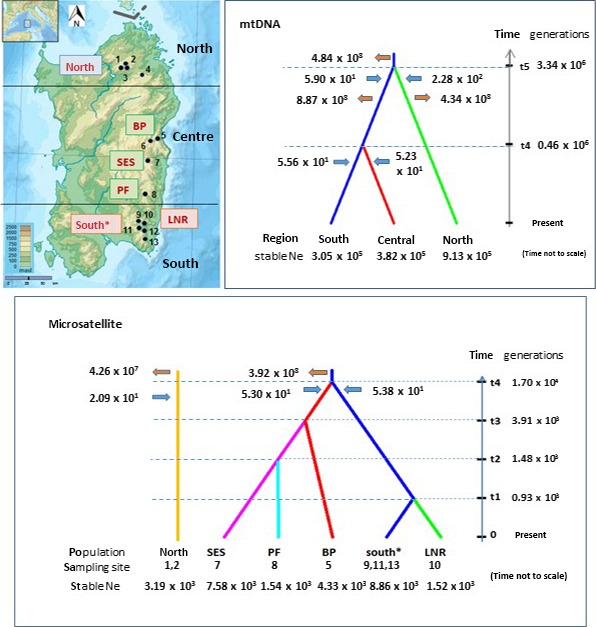
Figure 6.

Approximate Bayesian computation scenarios for mtDNA and microsatellite datasets. Supported scenarios for divergence between regions (mtDNA datasets), and between populations (microsatellite datasets). The approximate locations of the sampling sites are shown on the topographic map. Times of divergences (not to scale) are derived from median posterior parameter distributions from replicate simulations (Figures S1D andd S6C). Bottlenecks are indicated by blue arrows and expansions by red arrows (time not to scale). Inferred parameter values for stable N e are shown beneath the populations. Inferred values for N e during population bottlenecks and expansions are shown next to the appropriate arrow. Note that mtDNA and microsatellite‐derived values are not directly comparable . South*:south populations CER, MAR, GUN
