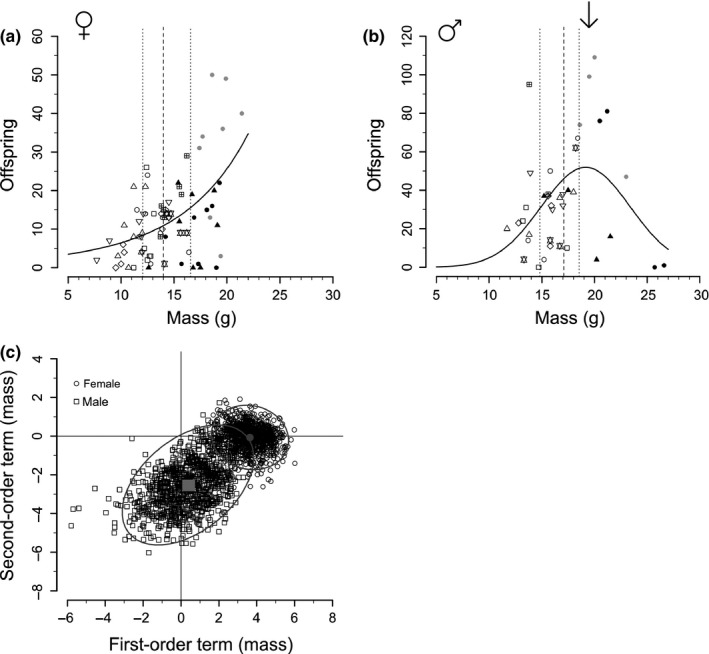
Figure 1.

Influence of body mass on fitness. (a) For female mice, body mass is positively correlated with fitness. (b) For males, there is a negative‐quadratic relationship with an optimal mass (arrow) for fitness. For (a,b) points represent individuals, grouped by population (shapes) from three studies (colors; S1: white/open. S2: black, S3: gray), solid lines indicate best fits, while vertical lines represent medians and quartiles. (c) Different patterns between females and males are demonstrated by first‐ and second‐order polynomial coefficients of mass from bootstrap GLMs. For females, first‐order terms are consistently positive, while second‐order straddle zero, suggesting a positive relationship between fitness and mass. For males, first‐order terms span zero, while second‐order terms are negative, suggesting a negative‐quadratic relationship. Gray centers demark mean values, and ellipses indicate 95% CIs
