
Figure 4.
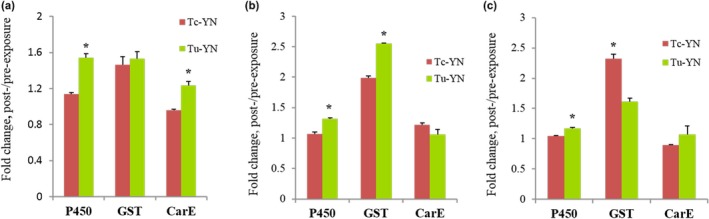
Induction of the specific activity of cytochrome P450s, glutathione S‐transferases (GSTs) and carboxylesterases (CarE) in Tc‐YN and Tu‐YN after treatment with various acaricides for 6 hr. (a) Abamectin treatment. (b) Fenpropathrin treatment. (c) Tebufenpyrad treatment. Asterisks on the error bars represent significant differences of the fold change between Tc‐YN and Tu‐YN within the same acaricide treatment