
Figure 6.
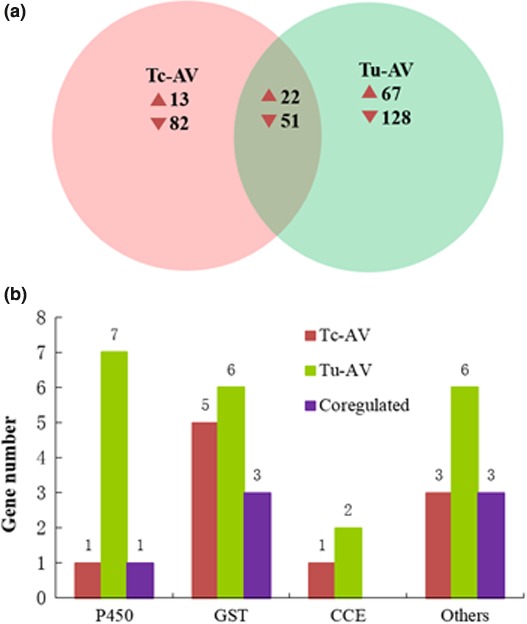
Summary of differentially expressed genes (DEGs) in each pairwise comparison following abamectin exposure. (a) Venn diagrams depicting overlap among DEGs of Tc‐YN and Tu‐YN exposed to abamectin, respectively. For each Venn diagram section, the numbers of transcripts differentially expressed in any strain with treatment as compared to control were indicated. (b) Distinctive and common differentially expressed (upregulated) genes of detoxification enzymes in the two previous comparisons. Tc‐AV: Tc‐YN were treated with abamectin; Tu‐AV: Tu‐YN were treated with abamectin. The category “others” included SDR, ID‐RCD, and ABC‐transporter genes