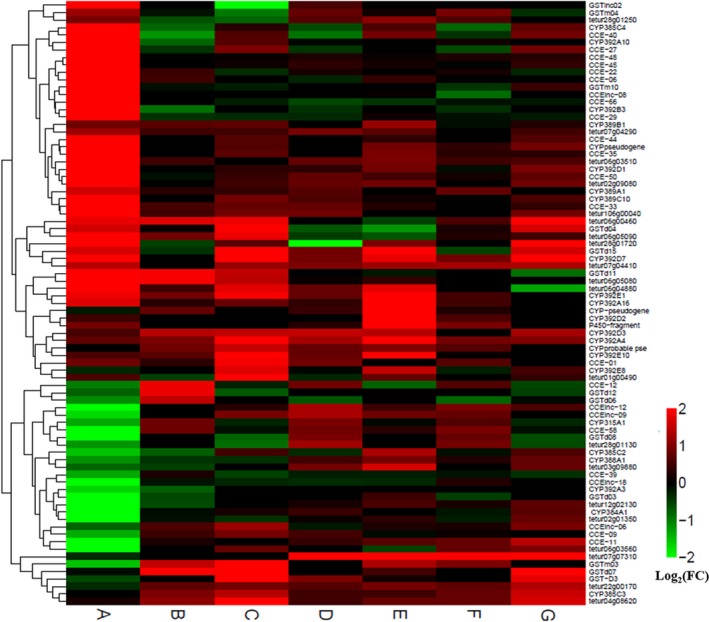
Figure 9.

Clustering of metabolic enzyme genes differentially expressed across strains. Hierarchical clustering analysis‐based transcription levels was performed on 81 enzyme‐encoding genes showing significant differential transcription (Fisher's test p value <.001) in Tu‐YN compared with Tc‐YN for samples both exposed to acaricides and compared to their respective controls. Clustering was obtained using Euclidean distance calculated from all Log2 (fold changes) and complete linkage algorithm. Color scale from green to red indicates Log2 (fold changes) from ‐2 (fourfold under transcription) to 2 (fourfold over transcription). For each gene, either the gene ID from the T. urticae genome or the functional annotation of the gene is indicated. (a) Tu‐YN vs. Tc‐YN, (b) Tc‐YN exposed to abamectin vs. Tc‐YN, (c) Tu‐YN exposed to abamectin vs. Tu‐YN, (d) Tc‐YN exposed to fenpropathrin vs. Tc‐YN, (e) Tu‐YN exposed to fenpropathrin vs. Tu‐YN, (f) Tc‐YN exposed to tebufenpyrad vs. Tc‐YN, (g) Tu‐YN exposed to tebufenpyrad vs. Tu‐YN. tetur06 g04880 tetur106 g00040 tetur06 g05080 tetur06 g05090 tetur28 g01720 tetur02 g01350 tetur28 g01130 tetur12 g02130 tetur07 g07310 tetur22 g00170 represent RCD gene; tetur01 g00490 tetur06 g00460 tetur04 g08620 tetur28 g01250 represent ID‐RCD; tetur02 g09080 represent sialin; tetur07 g04290 tetur07 g04410 tetur03 g09880 tetur06 g03560 tetur06 g03510 represent ABC transporters. FC: Fold Change
