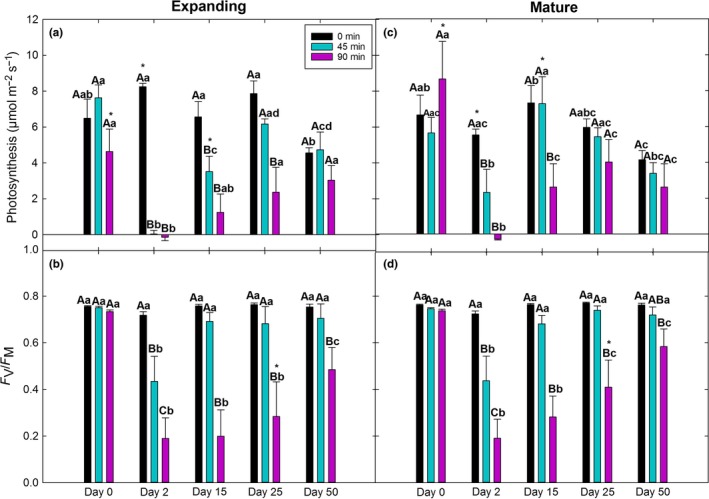
Figure 1.

Time courses of photosynthesis and F V/F M of expanding (a, b) and mature (c, d) leaves from the same plants (N = 4) of the 0‐min (controls), 45‐min, and 90‐min groups at 0, 2, 15, 25, and 50 days after treatment. Different uppercase letters represent significant differences among treatments within each day and leaf age. Different lowercase letters represent significant differences among days within treatment and leaf age. Asterisks represent significant differences between leaf age within treatment and day. Error bars represent ± SE
