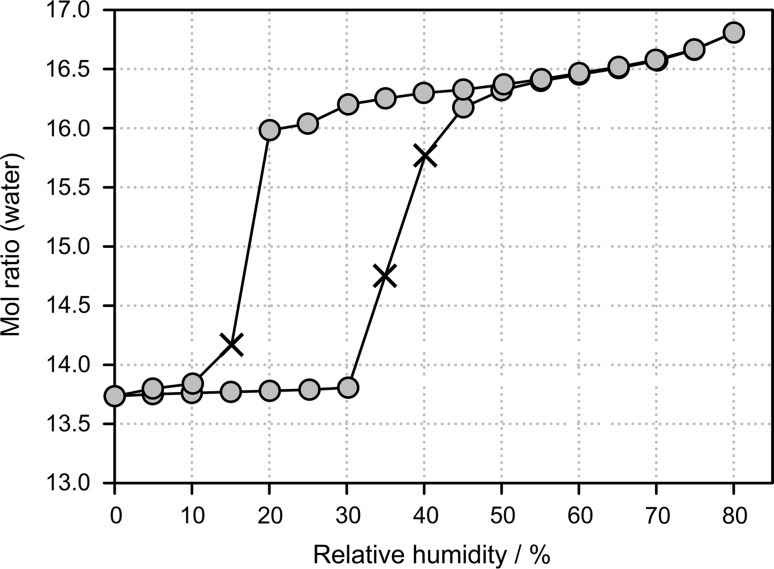
Fig. 5.
Gravimetric moisture sorption and desorption curves of alunogen at 25 °C. The gray circles represent data points reaching the equilibrium (constant mass) within the pre-set maximal equilibration time, whereas crosses mark data points where the sample did not reach the equilibrium moisture content within the allowed time limit of 48 h

