
Fig. 1.
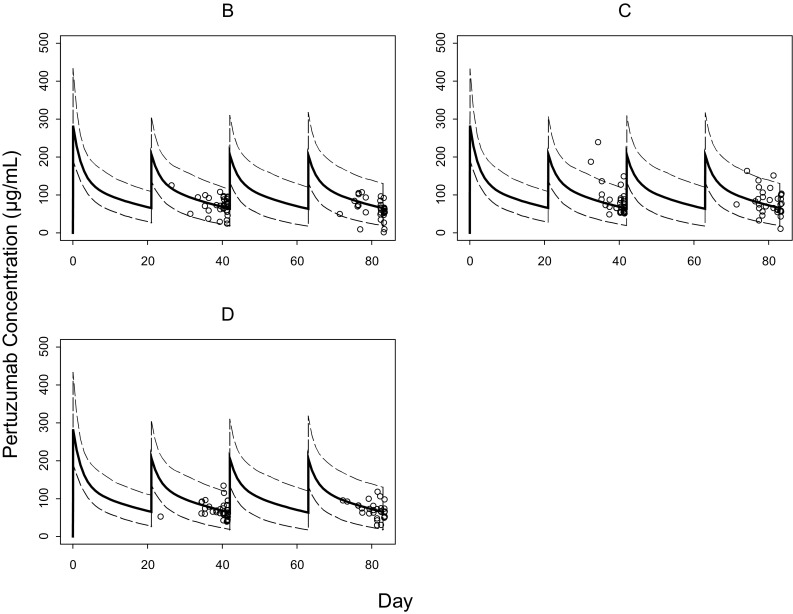
Observed versus simulated pertuzumab serum concentrations by treatment group. The dashed lines represent 97.5th and 2.5th percentiles based on simulations by the population PK model and the observed lean body weight and albumin distributions in NeoSphere. The solid lines are the population PK model predictions for a patient with the median values of lean body weight and albumin for each treatment group. The open circles represent C trough serum concentrations observed for NeoSphere patients