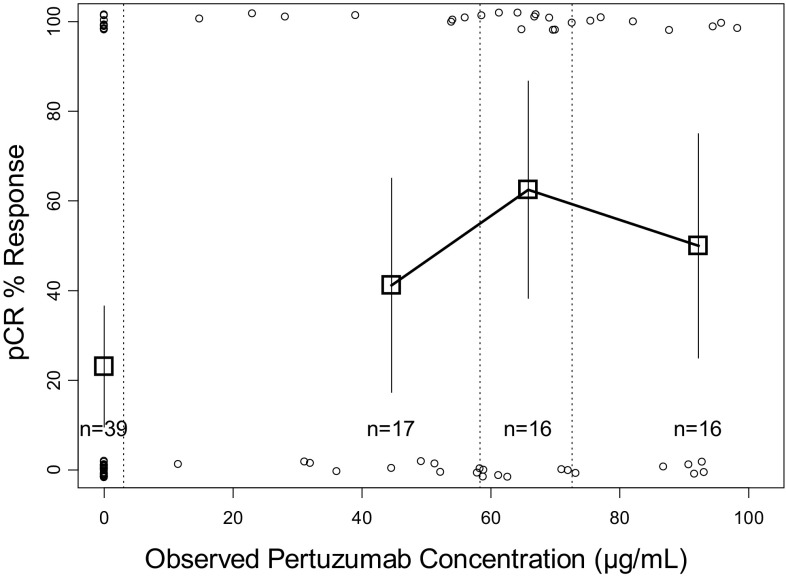
Fig. 4.
pCR response rate versus pertuzumab predicted C trough serum concentrations (in combination with trastuzumab and docetaxel). Square symbols represent percent pCR (pathological complete response) of the patients grouped by pertuzumab serum concentration into third tiles (separated by vertical dashed lines). The group with zero pertuzumab serum concentration refers only to all patients in Arm A. Error bars represent 2 × standard error [2 × √(p×(1 − p)/n)]. The open circles represent the response status of individual patients (0% = non-responder, 100% = responder)

