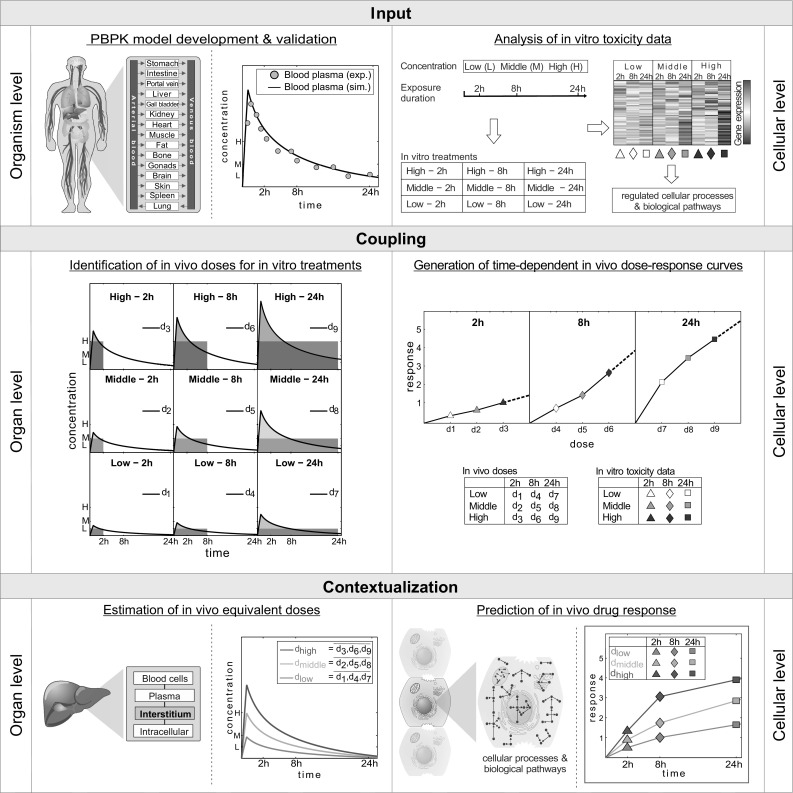
Fig. 2.

Workflow of PICD. Input At the organism level, PBPK models are developed at the organism level whereby simulated (sim.) blood plasma concentrations are validated with experimental (exp.) PK data. At the cellular level, in vitro toxicity data of compound-treated primary hepatocytes are analyzed (Igarashi et al. 2015). The hepatocytes were exposed to three different concentrations (low, middle and high). Drug-treated hepatocytes were compared to their time-matched controls to determine the change in gene expression after 2, 8 and 24 h leading to a total of nine different treatments (white–gray-colored symbols). Functional enrichment analysis was then applied to find regulated cellular processes and biological pathways. Coupling In vivo doses d 1–d 9 are identified for all treatments such that the in vivo exposure simulated in the interstitial space of the liver (colored area under the curve) matched the in vitro exposure (gray rectangular area). Identified in vivo doses d 1–d 9 together with in vitro toxicity data (white–gray-colored symbols) are used to generate dose–response curves for all considered time points of the in vitro experiment. Contextualization In vivo doses d 1–d 9 are averaged horizontally along the same in vitro concentration leading to three doses d low, d middle and d high (colored lines) representing the in vivo equivalents to exposed in vitro concentrations (low, middle, high). At the cellular level, in vivo drug response over time reflecting changes in cellular processes and biological pathways are then predicted (colored symbols) for the in vivo equivalent doses (colored lines) by using time-dependent in vivo dose–response curves (color figure online)
