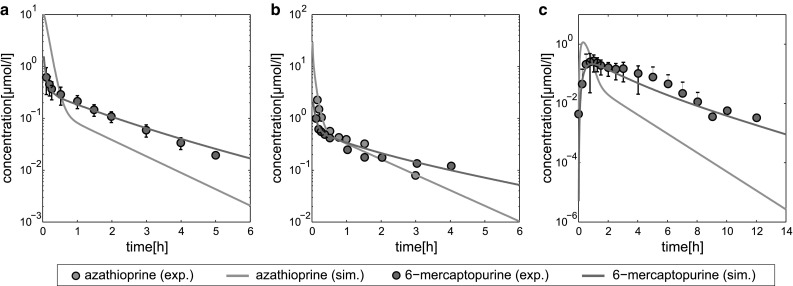
Fig. 4.

PBPK model development and validation. Simulated concentration–time curves (lines) for azathioprine (blue) and 6-mercaptopurine (red) were assessed with experimental PK profiles (circles) (Van Os et al. 1996). The reference PBPK model was then validated by evaluating simulated PK profiles with experimental PK data from different clinical studies (Odlind et al. 1986; Zins et al. 1997) (Table S2) not used to establish the reference model. Azathioprine was either administered intravenously (IV) or orally (PO). a Reference, 50 mg IV. b Validation, 100 mg IV. c Validation, 100 mg PO (color figure online)
