Fig. 7.

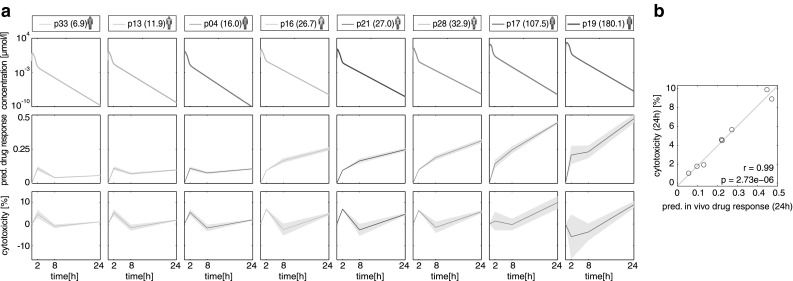
PICD applied on eight clinical cases of acute azathioprine overdose. a Simulated drug concentration–time profiles, corresponding predicted in vivo drug response of a critical toxicity-related pathway (DNA damage and repair), as well as predicted cytotoxicity for eight clinical cases following oral administration of different azathioprine overdoses (Table S3). In vivo drug responses and cytotoxicity were predicted for both replicates to represent the variability (gray area) (Igarashi et al. 2015). The mean drug responses are shown as solid lines. Colors of patients indicate the highest Poisoning Severity Score (PSS) (Persson et al. 1998) of the occurred symptoms [none (green) = 0, minor (yellow) = 1, moderate (red) = 2]. The overdoses (mg/kg) are shown in brackets. b Correlation results of predicted in vivo drug response of DNA damage and repair at 24 h with predicted cytotoxicity values. Correlation analysis was performed by calculating Pearson’s correlation coefficient r and the corresponding p value p (color figure online)
