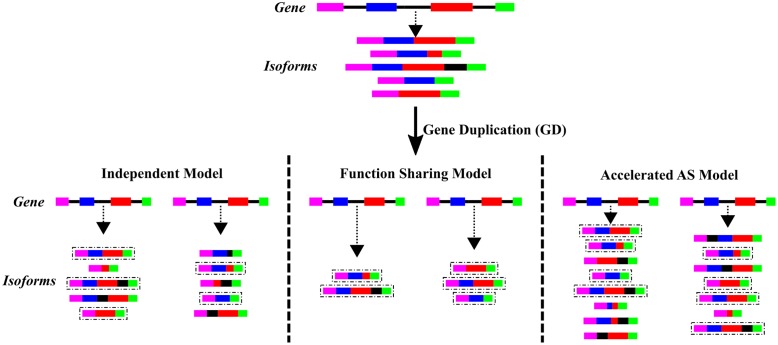
FIGURE 2.
Evolutionary models of AS after GD. The three different proposed models of evolution of AS after GD are depicted. Color boxes represent exons while black lines represent introns from a gene. The upper part represents a single-copy gene, before GD, that give rise to the different mRNA isoforms (connected by a dash-line arrow) due to AS. The lower part represents the same gene after GD and each of the possible evolutionary models of AS. The isoforms highlighted in a dashed line box represent those present before GD.

