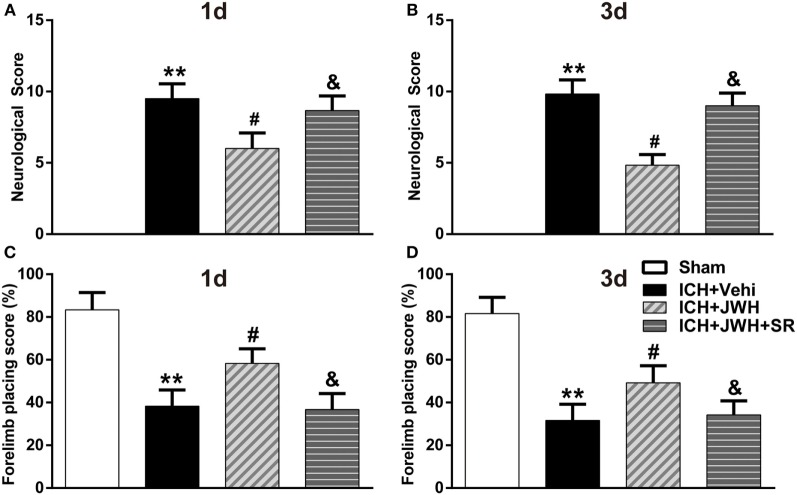
Figure 3.
Neurological deficit scores. Results of modified Neurological Severity Score test at 24 h (A) and 72 h (B), and forelimb placing test at 24 h (C) and 72 h (D). Each experiment was repeated three times and the average value was taken for statistics. Vehi, Vehicle; JWH, JWH133; SR, SR144528. Values were expressed as the mean ± SD, n = 6 per group. **P < 0.01 compared with sham group; #P < 0.05 compared with ICH + Vehi group; &P < 0.05 compared with ICH + JWH group.

