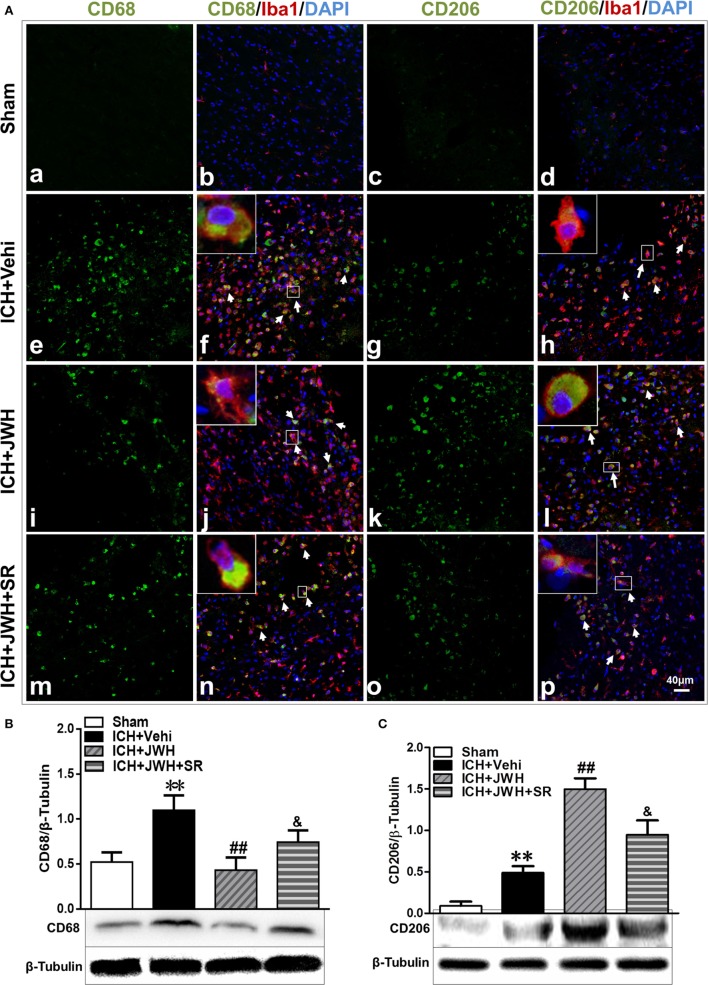
Figure 6.
M1/M2-associated markers of microglia at protein level. Perihematomal tissue was costained for CD68 (M1 marker) (green) and Iba1 (microglia marker) (red), or CD206 (M2 marker) (green) and Iba1 (red) at 24 h after intracerebral hemorrhage (ICH) (A). Cell nucleus was stained with DAPI (blue). White arrows pointed to typical cells. n = 6 in per group. CD68 (B) and CD206 (C) were also tested using western blots. Values of the relative densitometric analysis were expressed as mean ± SD, n = 6 in each group. **P < 0.01 compared with sham group; ##P < 0.01 compared with ICH + Vehi group; &P < 0.05 compared with ICH + JWH group.

