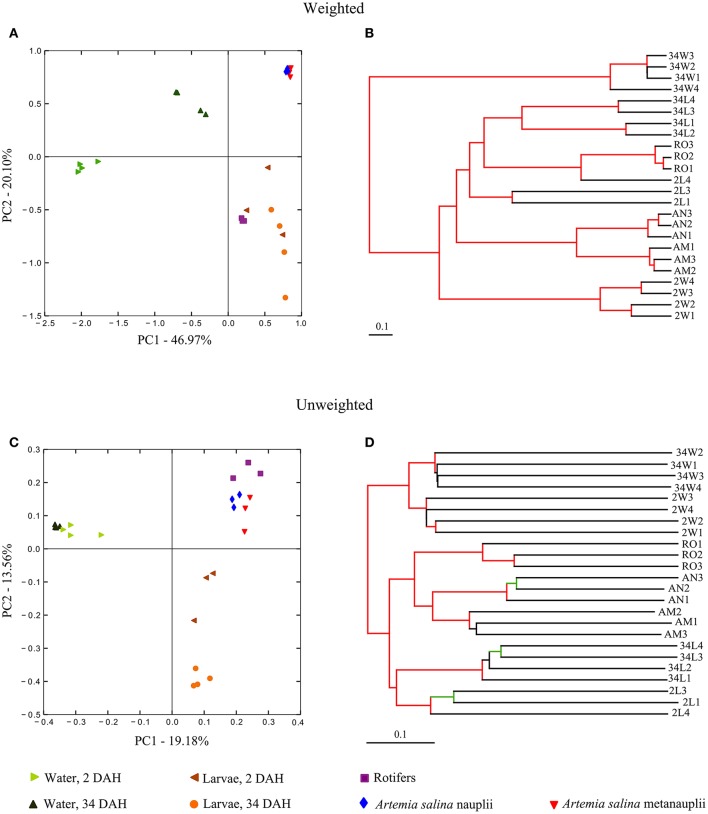
Figure 4.
Phylotype (OTU)-level ordination of bacterial communities in gilthead seabream larviculture. Principal coordinates analyses (PCoA) were performed with weighted (A) and unweighted (C) Unifrac measures applied to size-normalized sequence libraries (1,900 reads per sample, singleton OTUs included). Corresponding cluster analyses performed on Unifrac measures using the UPGMA algorithm are displayed next to the PCoA plots (B,D) to reveal the discrete grouping of samples from the same similarity matrix. The robustness of the clusters was assessed by means of a jackknifed beta diversity permutation test and are revealed in the UPGMA dendrograms. Cluster nodes with bootstrap values above 75% are marked in red. Cluster nodes with bootstrap values between 50 and 75% are marked in green. Labeling of sample categories is as described in legend to Figure 1. See Figure S1 for analyses performed after exclusion of singleton OTUs from the dataset.

