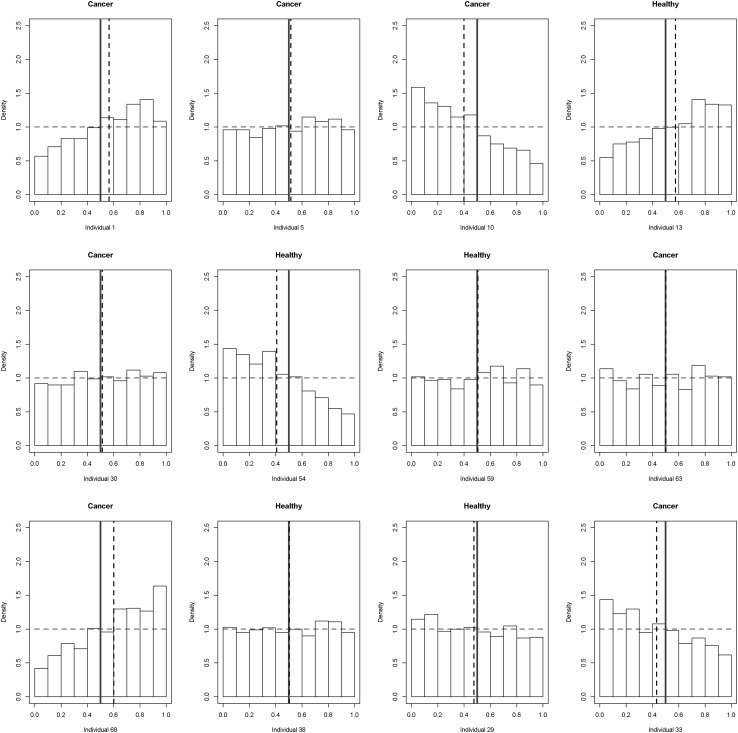
Fig. 5.
Individual distribution of prior and posterior probability of cancer estimated based on 13 nucleosides/creatinine excretion rates for 12 randomly selected individuals from the validation set. Red dotted line represents the prior assumed, histograms denote posterior probability distribution. Vertical blue line denotes the mean of posterior probability of cancer

