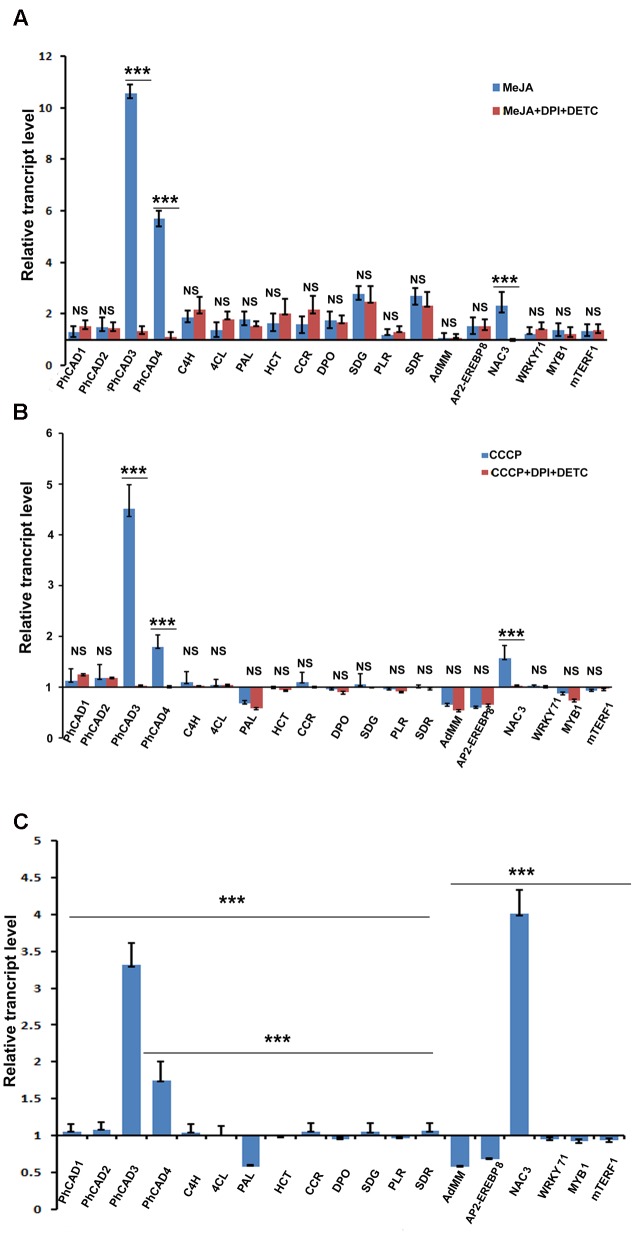
FIGURE 2.
Transcript assay of 19 ptox biosynthetic pathway genes after various treatments. (A) Expression pattern after MeJA and MeJA+DPI+DETC ttreatment. (B) Expression pattern after CCCP and CCCP+DPI+DETC treatment. (C) Expression pattern after H2O2 treatment. The statistical analysis of the difference between fold changes was done using GraphPad Instat-3 software. Comparison between groups was done using one-way analysis of variance (ANOVA) followed by Student–Newman–Keuls test. Data were fitted using Sigma plot represented as means ± SD. p < 0.05 was accepted as level of significance; ∗∗∗ highly significant p < 0.001; ∗∗ significant p < 0.01; ∗ less significant p < 0.05; NS not significant for p > 0.05.

