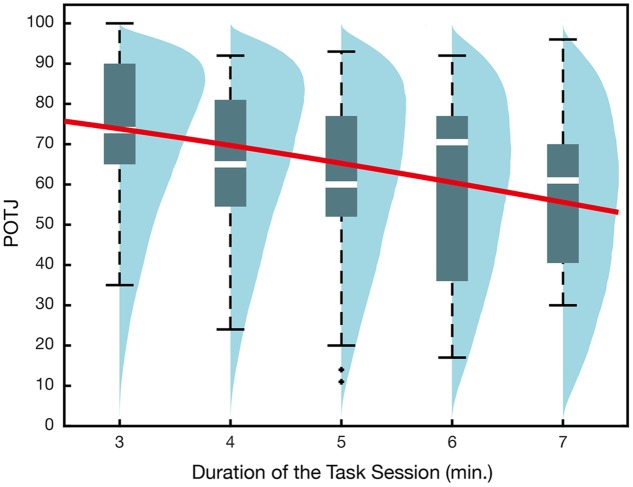
FIGURE 2.
Passage of time judgment in Experiment 1a. The x-axis corresponds to the durations that participants actually worked on the 2-back task. All participants were instructed that the task session would take 5 min. The overlaid regression curve indicates mean qi obtained in GLMM recruiting actual duration only as the explanatory variable. Blue density plots are simulated POTJ distribution density incorporating random effects.

