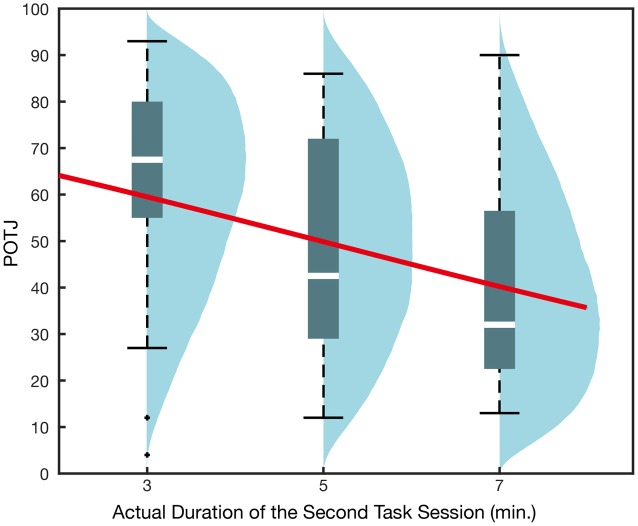
FIGURE 4.
Passage of time judgment in Experiment 2. The x-axis corresponds to the durations of the second task session. All participants were instructed that the two task sessions would take 5-min each and underwent the first task session, whose duration was actually 5 min. The overlaid regression curve indicates mean qi obtained in GLMM recruiting the duration of the second session only as the explanatory variable. Blue density plots are simulated POTJ distribution density incorporating random effects.

