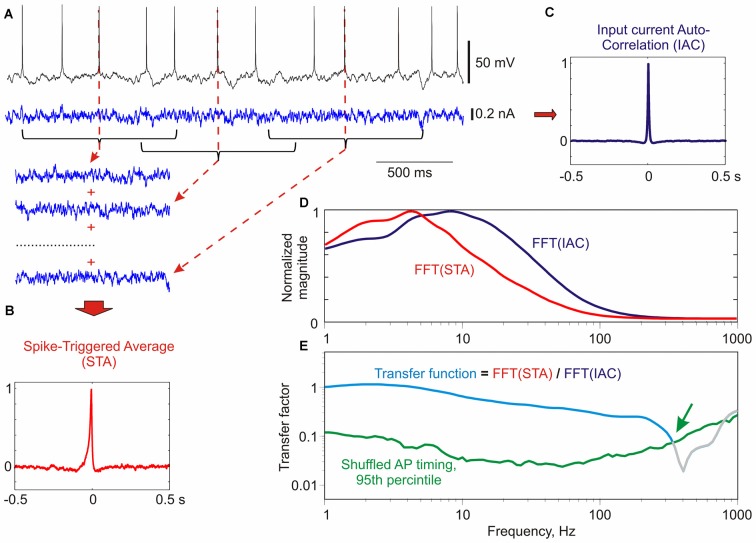
Figure 2.
Calculation of frequency transfer function of a culture neuron using noise injection. (A) Response of a neuron in culture to injection of fluctuating current. For calculation of spike-triggered average (STA) 1 s portions of the injected current centered at each spike were used. Three such segments are shown for clarity. (B) Normalized STA of the injected current. (C) Normalized auto-correlation function of the injected current (IAC). (D) Normalized Fast Fourier Transformation (FFT) transforms of the spike-triggered average FFT(STA), and of the input auto-correlation FFT(IAC). (E) Transfer function (cyan) calculated as the ratio of the normalized FFT transforms of the STA and the input auto-correlation. Green line shows 95th percentile of “shuffled” transfer functions (N = 500), calculated as above, but using shuffled instead of real timings of spikes. Values above the 95th percentile of shuffled transfer function are considered significant. The transfer function was cut at the intersection with the 95th percentile (green arrow). Method of calculation of transfer function is based on Higgs and Spain (2009); significance estimation as in Ilin et al. (2013).

