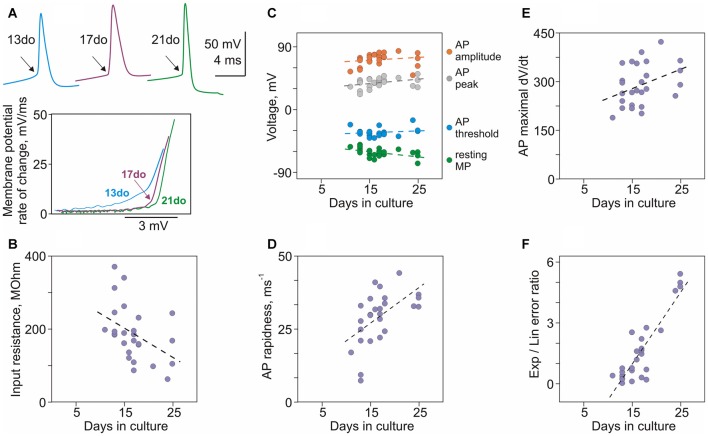
Figure 4.
Maturation of membrane properties and action potential (AP) generation in cultured neurons. (A) APs from three neurons cultured for 13, 17 and 21 days, and their onsets in phase plots. In the phase plots, APs were shifted along the X-scale (voltage) to facilitate comparison of their onset dynamics. (B) Decrease of input resistance with age (r = −0.49, p = 0.006, N = 29). (C) Correlation of resting membrane potential (r = −0.50, p = 0.006), and AP threshold (r = 0.003, p = 0.99), peak (r = 0.36, p = 0.053) and amplitude (r = 0.42, p = 0.024) with age of cultured neurons. (D) AP rapidness increases with age (r = 0.65, p < 0.001). (E) Maximal rate of rise of APs increases with age (r = 0.46, p = 0.013). (F) The ratio of errors of the exponential and the linear fits of AP onset increases with age (r = 0.63, p < 0.001).

