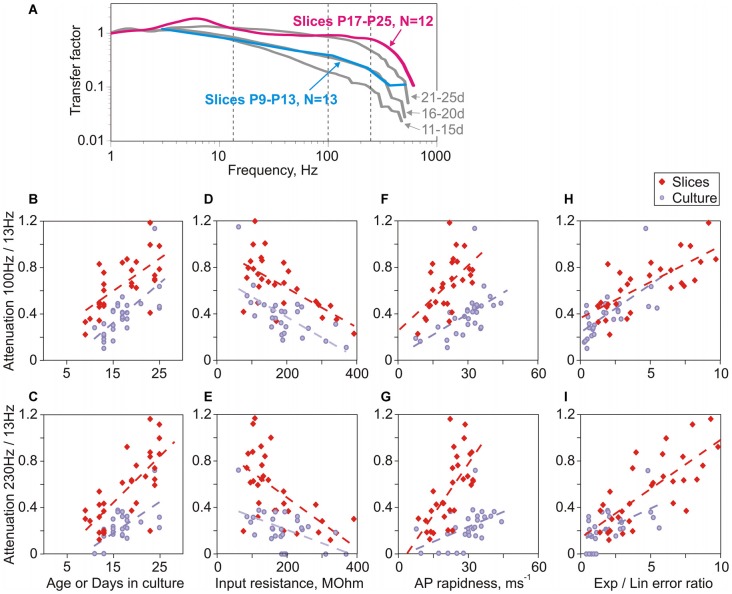
Figure 6.
Parallels in the age-dependent improvement of encoding of high frequencies in neurons in slices and in cultures. (A) Averaged transfer functions for two groups of neurons in slices prepared from 9 to 13 day old rats (cyan, N = 13) and 17–25 day old animals (magenta, N = 12). For comparison, transfer functions for three age groups of cultured neurons are shown (gray; 11–15 day; 16–20 day and 21–25 day; data from Figure 3B). (B,C) Correlation between attenuation of encoding of high frequencies (B: 100 Hz/13 Hz; C: 230 Hz/13 Hz) and age for slice neurons (red diamond symbols, B: r = 0.35, p = 0.056; C: r = 0.72, p < 0.001) or days in culture for cultured neurons (lilac circles, B: r = 0.72, p < 0.001; C: r = 0.63, p < 0.001). (D,E) Correlation between attenuation of encoding of high frequencies (D: 100 Hz/13 Hz; E: 230 Hz/13 Hz) and input resistance for neurons in slices (red diamonds, D: r = −0.41, p = 0.022; E: r = −0.62, p < 0.001) and in cultures (lilac circles, D: r = −0.71, p < 0.001; E: r = −0.45, p = 0.013). (F,G) Correlation between attenuation of encoding of high frequencies (F: 100 Hz/13 Hz; G: 230 Hz/13 Hz) and AP onset rapidness for neurons in slices (red diamonds, F: r = 0.28, p = 0.12; G: r = 0.72, p < 0.001) and in cultures (lilac circles, F: r = 0.71, p < 0.001; G: r = 0.54, p = 0.002). (H,I) Correlation between attenuation of encoding of high frequencies (H: 100 Hz/13 Hz; I: 230 Hz/13 Hz) and the ratio of errors of exponential to linear fits for neurons in slices (red diamonds, H: r = 0.55, p = 0.001; I: r = 0.75, p < 0.001) and in cultures (lilac circles, H: r = 0.69, p < 0.001; I: r = 0.53, p = 0.003).

