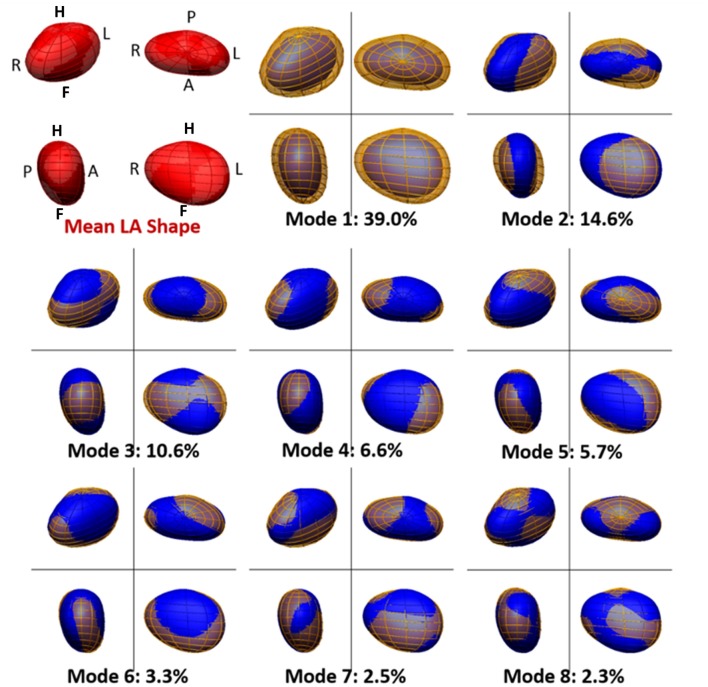
Figure 3.
Mean and main modes of variation of the left atrial shape in the cohort of 144 atrial fibrillation patients. The mean left atrial shape in the cohort is depicted in red in the top left panel. Other panels depict the LA shape variation encoded by each PCA mode. For each mode, the blue mesh depicts the LA shape obtained by adding, to the mean LA shape, 2 standard deviations (std) of the data along that PCA mode. Similarly, the yellow mesh represents the LA shape obtained by subtracting 2 std of the data along the PCA mode from the mean. The modes are ranked descendingly according to the amount of variation in the data they explain. This is shown, for each mode, as a percentage of total data variation. For each depiction of the left atrium, four views are shown, with the same orientation as in Figure 1.

