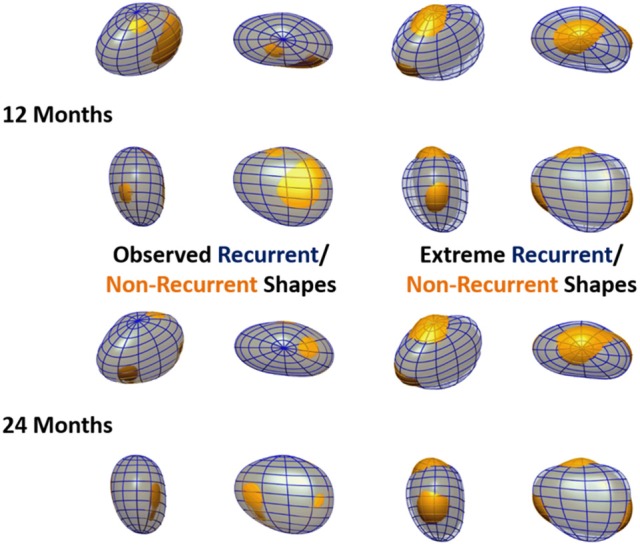
Figure 5.

Observed and extreme recurrent and non-recurrent left atrial shapes. Recurrent shapes are depicted by a transparent blue wireframe throughout, whereas non-recurrent shapes are shown in yellow. Left: Mean recurrent and non-recurrent shapes, computed using the data in the cohort. Right: Extreme recurrent and non-recurrent shapes, computed by adding/subtracting 2 standard deviations of the data along the oLDA mode to the mean LA shape. Recurrence status is defined at 12 months in the top panels and 24 months in the bottom panels. All meshes are shown in 4 orthographic views, as labeled in Figure 1.
