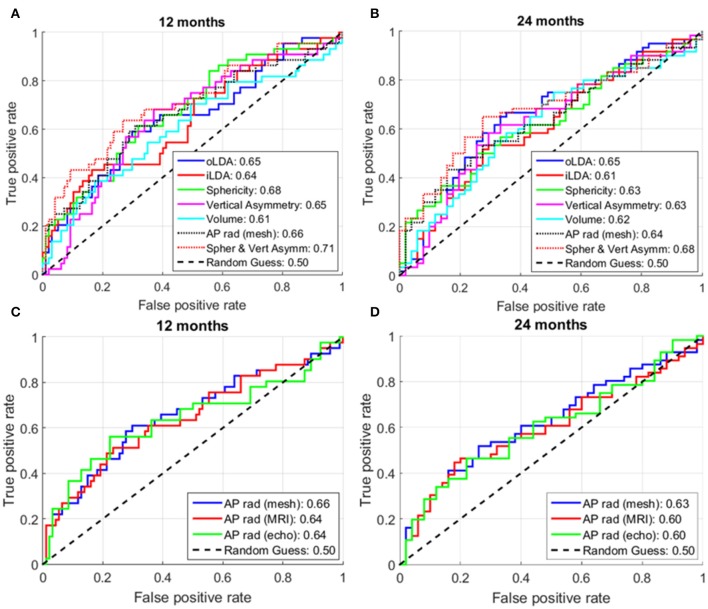
Figure 7.
Receiver operator characteristic (ROC) curves for different analyzed shape markers. (A,C) At 12 months post-ablation. (B,D) At 24 months post-ablation. The numbers in the legend show the area under the curve (AUC) for the corresponding shape markers. For each metric, the higher the AUC, the better its ability to distinguish between recurrent and non-recurrent LA shapes. The maximum number of subjects for whom all data was available was used in these analyses, corresponding to: (A) 141; (B) 111; (C) 135; and (D) 106 patients.

