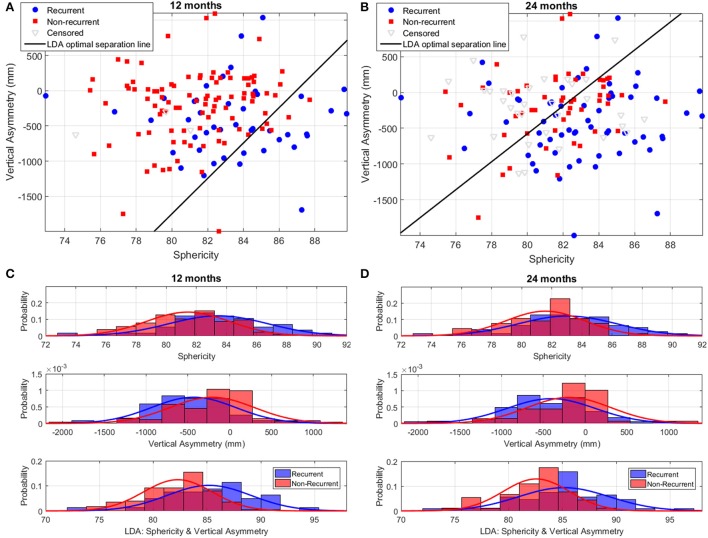
Figure 8.
Discrimination of recurrent and non-recurrent cases using sphericity, vertical asymmetry, and the LDA combination of the two at 12 and 24 months post-ablation. (A,B) Scatter plots of patient data in the sphericity-vertical asymmetry space, showing the optimal separation line between recurrent and non-recurrent cases as computed using LDA. The position of censored (lost follow-up) data is also shown. (C,D) Histograms and corresponding Gaussian distribution fits for recurrent and non-recurrent populations according to sphericity (top panel), vertical asymmetry (middle panel), and the LDA combination of the two (bottom panel). The left/right panels depict results at 12/24-months post-RFCA.

