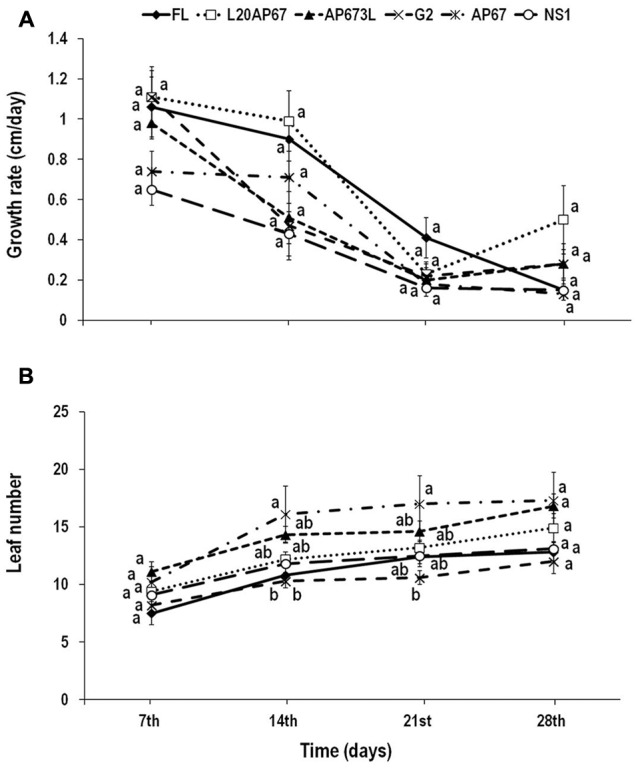
FIGURE 1.

Growth rate (height increment in cm every 7 days) (A) and leaf number (B) of Quercus ithaburensis seedlings cultivated under the FL, L20AP67, AP673L, G2, AP67, and NS1 light treatments during a 28-day period. Different letters within the lines indicate significant differences among light treatments at p < 0.05. Data are mean values (n = 10) ± SE.
