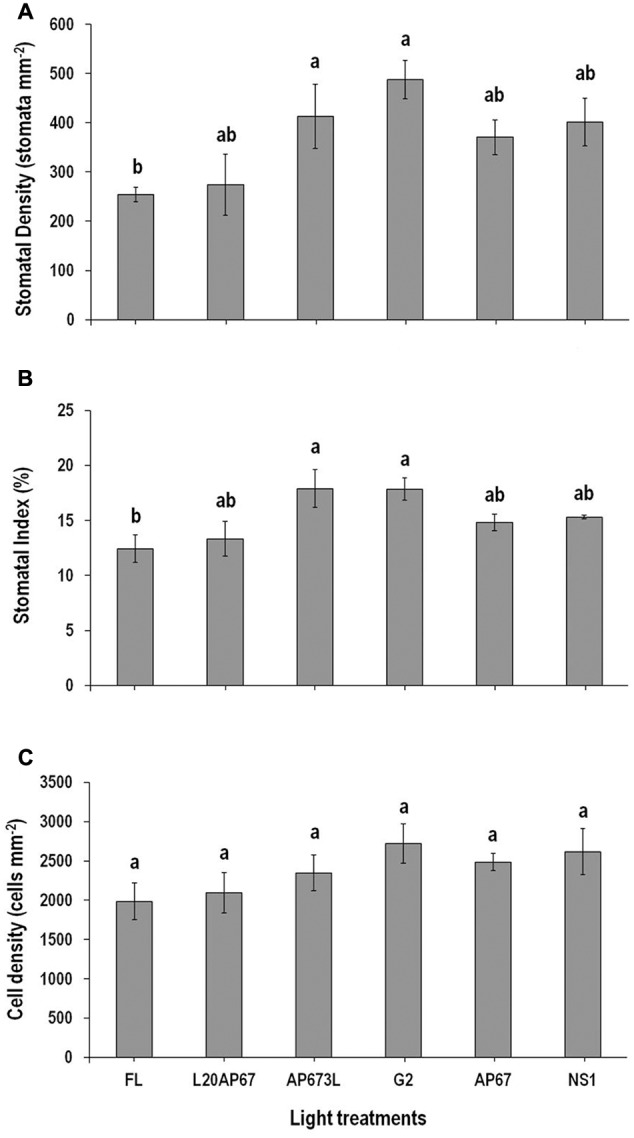
FIGURE 2.

Stomatal density (SD) (A), stomatal index (SI) (%) (B), and cell density (CD) (C) on the abaxial leaf surface of Q. ithaburensis seedlings cultivated under the FL, L20AP67, AP673L, G2, AP67, and NS1 light treatments at the end of the 28 days experimental period in the growth chambers. Different letters within the columns indicate significant differences among the light treatments at p < 0.05. Data are mean values (n = 5) ± SE.
