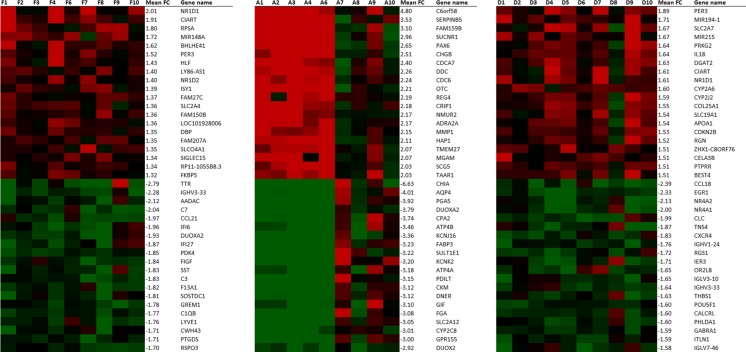
Fig. 1.
Expression of most highly significantly upregulated and downregulated genes in fundus, antrum and duodenum, respectively. Green is a signal log ratio of −2, and red is a signal log ratio of 2. Apart from the mean fold change (FC) of the top regulated genes by the treatment, signal log ratios are displayed to show inter-individual differences

