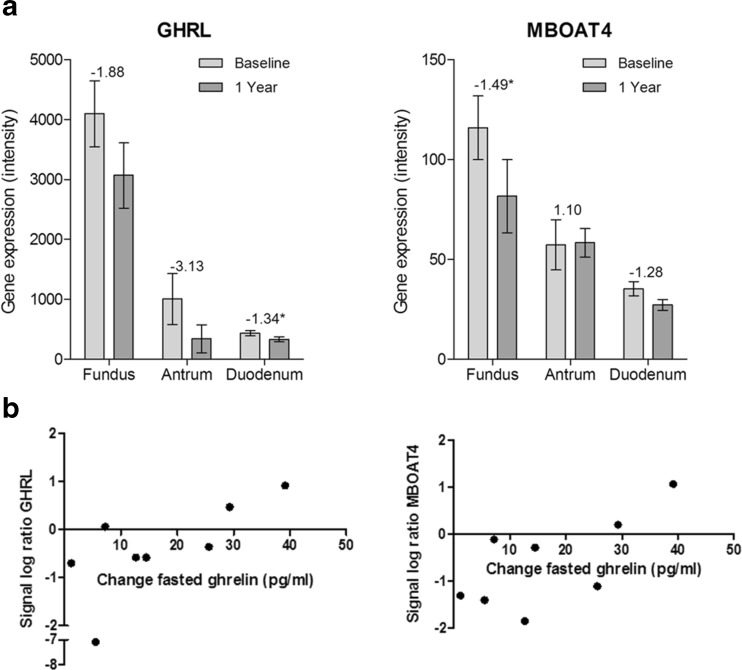
Fig. 3.
Changes in gene expression of ghrelin and MBOAT4 and their correlation to plasma ghrelin. a The graphs show RMA normalized intensities of microarray data at baseline and 1 year after gastroplication in biopsies of fundus, antrum and duodenum. Fold changes are indicated on top of the bars, significant changes are marked with asterisk (p < 0.05). All graphs show mean and SEM. b Correlation between signal log ratios of ghrelin (GHRL) and MBOAT4 in the fundus with changes in plasma active ghrelin levels measured in a fasted state before and 1 year after the procedure

