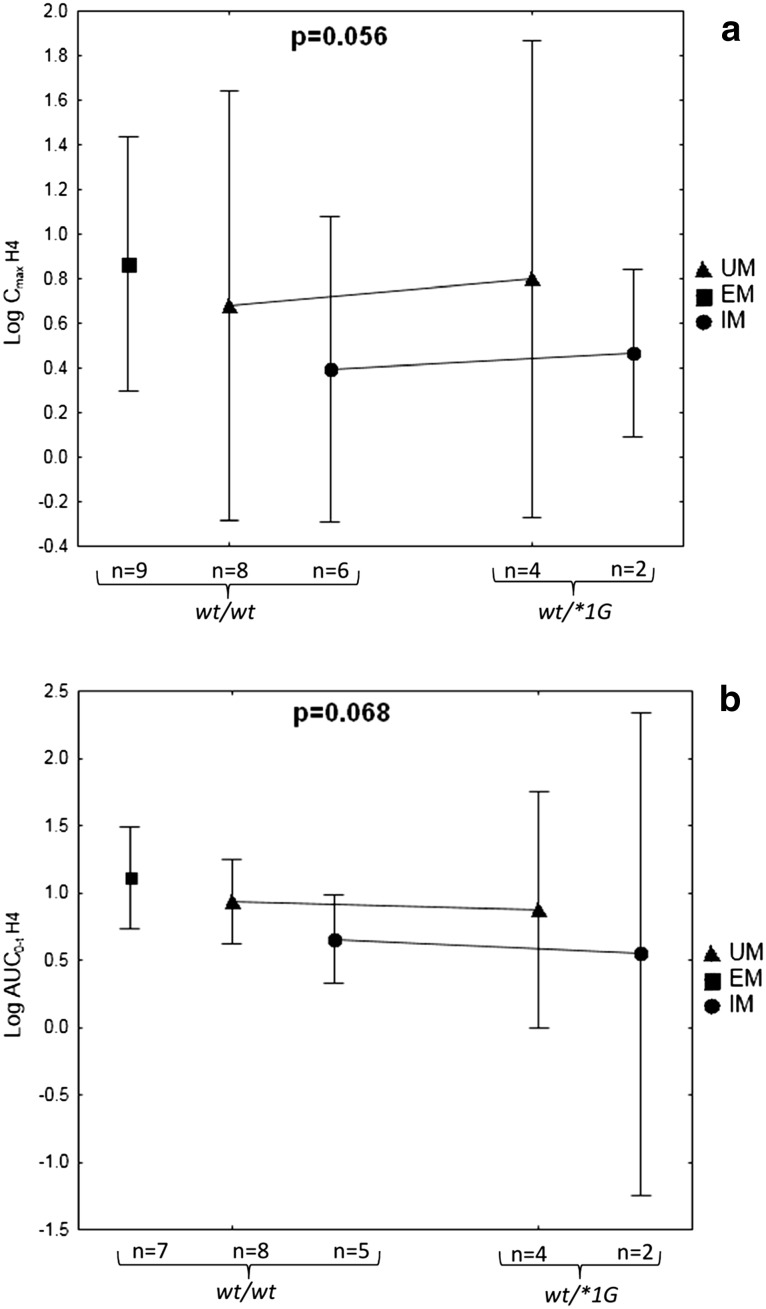
Fig. 3.
Influence of CYP3A4*1G and CYP2C19 phenotype on C max (a) and AUC0–t (b) of H4 metabolite. Data are presented as means with 95 % confidence intervals as whiskers. Presented values of p refer to the model. UM CYP2C19 ultrarapid metabolizer, EM CYP2C19 extensive metabolizer, IM CYP2C19 intermediate metabolizer, AUC0–t area under the concentration time curve from time zero to time t, C max maximum plasma concentration, CYP cytochrome P450

