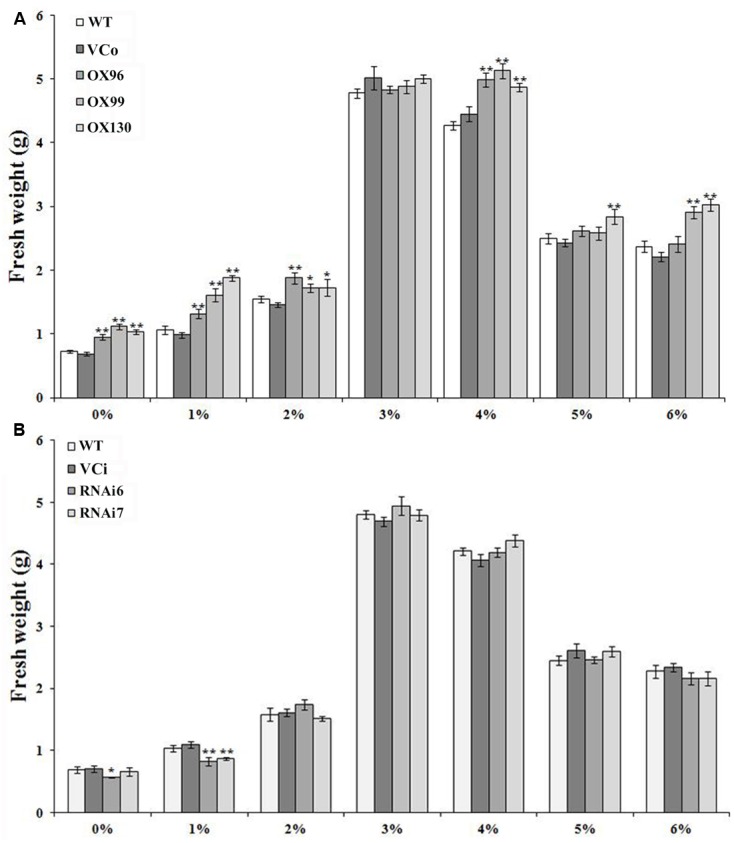
FIGURE 5.

Responses of transgenic Lizixiang plants and control plants cultured on MS media supplemented with different sucrose concentrations. Fresh weights (FWs) were measured after 4 weeks of growth. (A) FWs of OX lines. (B) FWs of RNAi lines. Data are presented as the mean ± SE (n = 3). ∗ and ∗∗ indicate a significant difference versus WT at P < 0.05 or P < 0.01, respectively, based on Student’s t-test.
