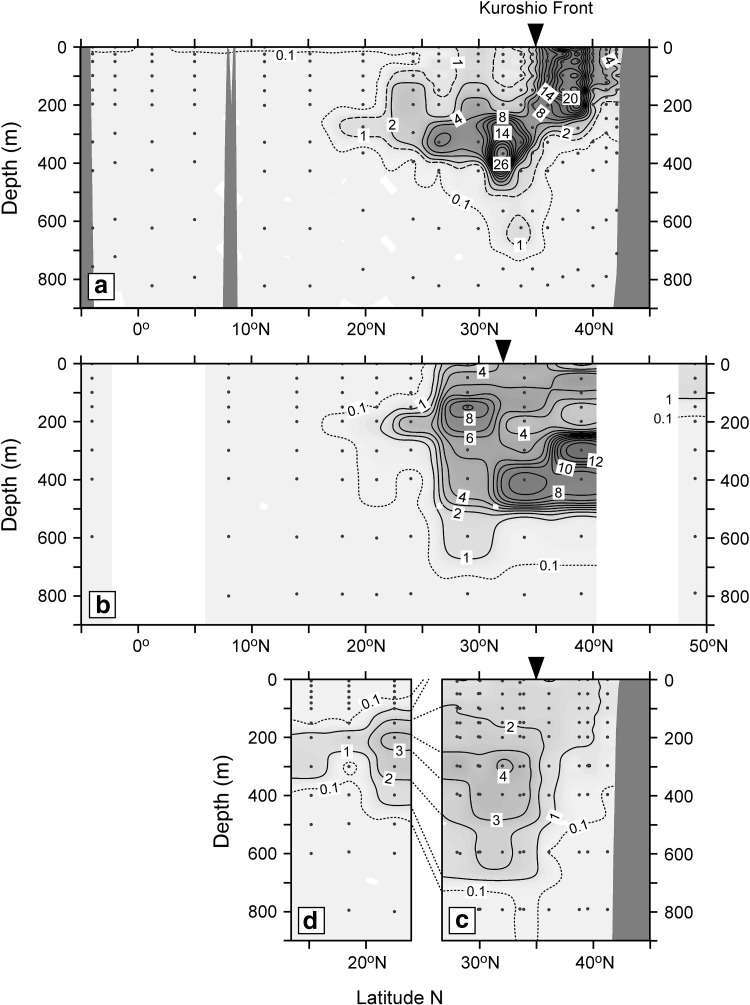
Fig. 3.
Cross sectional views of 134Cs activity concentration (Bq m−3) along approximately 145°E–150°E in January–February 2012 (a) [41], 165°E in June–July 2012 (b) [30], approximately 142°E–155°E in March–July 2014 (c), 163°E–165°E in December 2014 (d). The activity concentration of 134Cs was corrected to the accident date. Contour interval in a is 2 Bq m−3 except for broken (1 Bq m−3) and dotted (0.l Bq m−3) lines. Contour interval in b, c, and d is 1 Bq m−3 except for dotted lines (0.l Bq m−3). Dots show sampling depths at each station for radiocesium measurements. Arrows indicate approximate position of the Kuroshio Front. This figure was drawn using Ocean Data View software [43]

